???? KEY FINDINGS
- ⅓ of search results on page 1 of Google are fake TV reviews (publications who say they test but have a Trust Score below 60%)
- 89% of the review sites ranking on page 1 do not test TVs.
- The majority of page 1 search results (54%) are reviews that don’t test TVs. As a consumer you have a 1 in 2 chance of running into an untrustworthy review.
- 1 out of 4 search results are publications owned by Future PLC. 10 of their 12 publications claim they test but have a failing Trust Score below 60%, including PC Gamer, TechRadar and T3.
Imagine you’re shopping for a brand new TV. You’ll probably do some initial research on Google and read a TV review or two. Now multiply that action by 6 million. Because in reality, 6.1 million TV review-related searches occur every month.
Enter Google’s biggest “expert product test” scam. What we uncovered was that more than half of Google’s search results DON’T test. The world’s biggest search engine is serving up misleading reviews, published by large media conglomerates like CNN, Forbes, and Rolling Stone.
Why the game?_
The TV industry has $7 billion in annual sales globally. From our internal numbers, the online TV review industry (for affiliates) boasts an annual gross profit of $6,806,142.
The allure of such high profits creates an environment susceptible to predatory behavior. Some reviewers take shortcuts that require little effort yet still rake in the dough, which are usually in the form of misleading, unreliable reviews that can misinform consumers into wasting money and time on a total dud of a TV.
KEY STATISTIC
⅓ of search results on page 1 of Google are fake TV reviews—the publications who say they test but have a Trust Score below 60%.
Gadget Review, TV Trust List 2023
How do we fix this problem?_
- Be aware of the prevalence of untrustworthy reviews.
- You can educate yourself by reading our annual Trust List of the most trusted testers in consumer tech.
- You can use our True Score on every product to pick the best one for your needs. If you’re curious about how we score with this system, True Score is a synthesis of trusted experts and customer ratings.
Who Do You Trust?_
We have been testing products for years! Gadget Review has tested almost 1,000 products in over a dozen categories. And now we are testing the testers. We know exactly what to test for and how the test is supposed to be measured.
The Types of Reviewers We Found_
During our Trust Score evaluation, we determined who tests the best, those who claim to test but don’t, and the sites who don’t claim to test but still have failing Trust Scores.
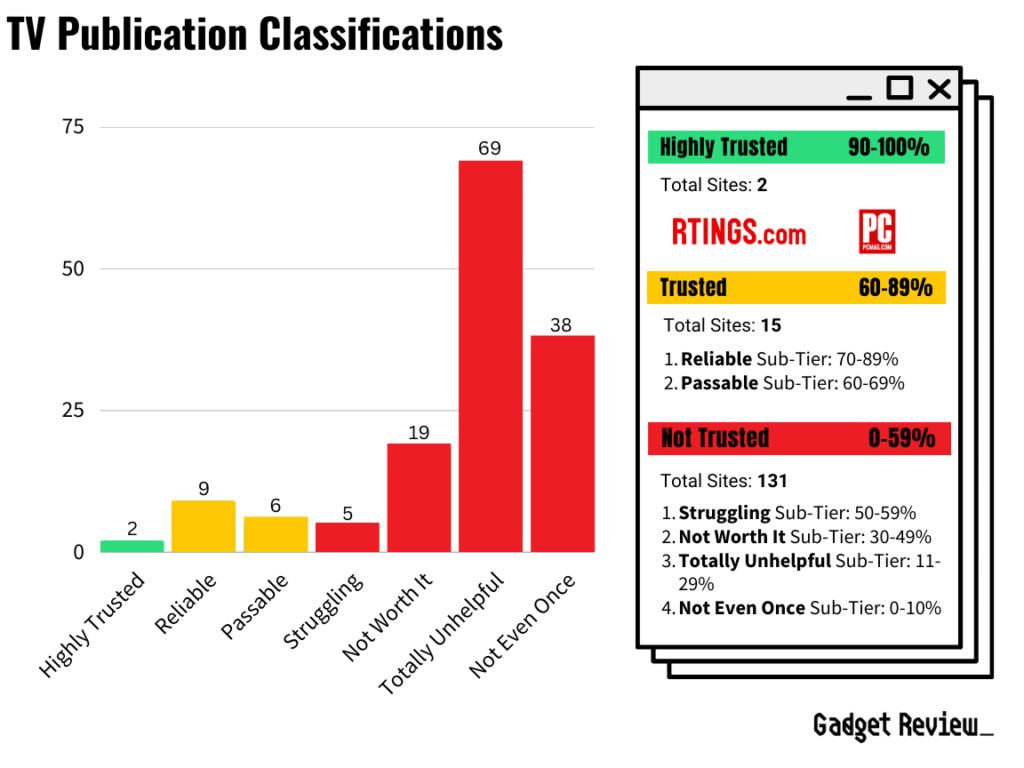
When our investigation concluded, we created TV expert classifications. We have 3 tiers of trust followed by smaller sub-tiers that exist in certain levels.
- Highly Trusted → 90-100+
- These sites passed our Trust Score evaluation by earning a score over 90%. The “cream of the crop” of publishers so to speak. Strong testing methods, plenty of photos, charts and graphs, and all the numbers you could ever ask for. We refer to them as “Industry Leaders”.
- RTINGs and PCMag are in this class.
- Trusted → 60-89
- These publications earn a passing Trust Score, provide you with enough quantitative testing to make a purchase decision, though they might feature more qualitative analysis and discussion than the top dogs do.
- Reliable Tier – 70-89; Solid info you can always rely on.
- Passable Tier – 60-69; Not as good, but still usable.
- These publications earn a passing Trust Score, provide you with enough quantitative testing to make a purchase decision, though they might feature more qualitative analysis and discussion than the top dogs do.
- Not Trusted → 0-59
- These testers failed the evaluation. It could be from a lack of support and proof for their testing, from being fraudulent in their claims about testing, or from simply not offering up enough useful information.
- Struggling Tier – 50-59; Might be on the come-up but they’re still failing.
- Not Worth it Tier – 30-49; Your time is better spent elsewhere.
- Totally Unhelpful Tier – 11-29; Not useful, could misguide you.
- Not Even Once Tier – 0-10; Don’t even bother.
- These testers failed the evaluation. It could be from a lack of support and proof for their testing, from being fraudulent in their claims about testing, or from simply not offering up enough useful information.
Here’s a bar chart below to help you visualize how the experts are distributed across the classifications. It’s crazy to think that 89% of sites that appear in the most popular TV search results failed our Trust Score evaluation.
The Keywords We Used_
The list of 169 TV keywords includes mostly the popular “best-of” keywords along with 44 best-seller TV model review keywords, such as:
- best 55 inch tv
- best gaming tv
- best oled
- lg c2 42 review
- hisense u8h review
- samsung s95b review
We evaluated all 149 sites with our Trust Score criteria to determine who publishes the most transparent and thoroughly-tested TV reviews.
See below for the full breakdown of how much presence each type of site has within the 1,613 search results. For full definitions of each type, we provide them below along with examples further down.
Type of Sites Presence Within The Search Results_
TYPE OF SITE
AVERAGE TRUST SCORE
NUMBER OF SITES
SEARCH RESULTS %
Multiple Tech Review
37.73%
895
55.49%
Niche Tech Review
26.03%
261
16.18%
Niche News
24.82%
192
11.90%
General eCommerce
9.40%
115
7.13%
General News
18.86%
84
5.21%
Video Review
33.80%
25
1.55%
Hyperniche Tech Review
19.32%
18
1.12%
Niche Service
20.30%
16
0.99%
Niche eCommerce
11.30%
7
0.43%
The type of site that earned the highest average Trust Score is the Multiple Tech Review type, which is still an unfortunate 37.73%. It’s interesting that 9 out of 10 of our top 10 trusted publications for TV reviews are the Multiple Tech Review type though, so the type isn’t completely unreliable. That average is so low, however, because out of the total 41 Multiple Tech Review sites, only 10 earned a score over 60%.
No single type of site passed as a whole, which can be a reflection of how this category’s reviewers have a lot of work to do.
The “Video Reviews “are YouTube results that appeared in the search results, which we had to score with criteria more curated towards video format.
Parent Company Presence Within The Search Results_
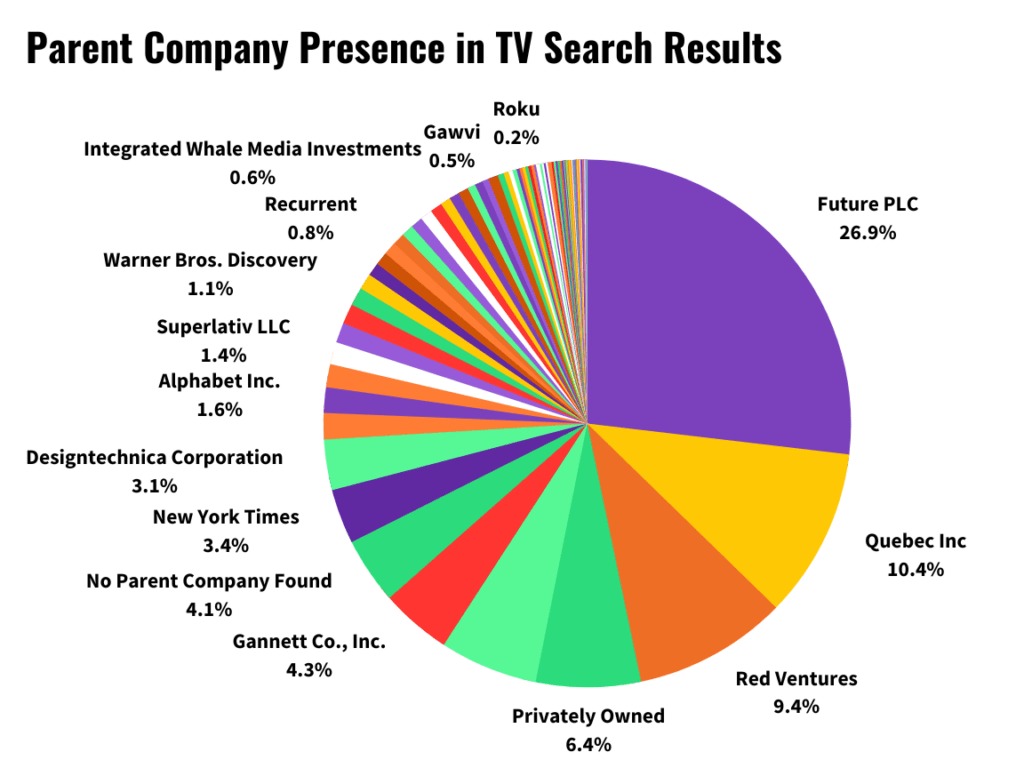
We found that Future PLC accounts for 433 of the 1,613 search results, which is the largest portion over any other parent company. This means you have a one in four chance of running into one of these Future publications while shopping online for TVs.
That number’s probably so high due to the large amount of publications that they own. However, their average Trust Score across their publications is nothing to write home about, it’s a saddening 37.21%. However, they do possess two of the top 10 most trustworthy publications. Wouldn’t it be great if all their publications were held to the same standard as their two MVPs?
Check out the following chart that visualizes how Future dominates the TV search results over any other parent or holding company.
Top 10 Trustworthy Publications That Test TVs_
Below are your Most Trusted Testers for 2023. Please note that if you see “No Parent Company Found” it refers to a company that’s not a subsidiary of a parent company. If they also have “No investors found”, that means they’re a self-funded business that isn’t financially supported by investors.
Publication #1: RTINGs
- Parent Company: Quebec Inc.
- Type of Site: Niche Tech Review
- TV Trust Score: 101.40%
- Total #1 Ranked TV Keywords: 4,189
- Monthly TV Traffic: 555,400
- How they earn their money: Affiliate programs, Selling products
Testing Quality Analysis:
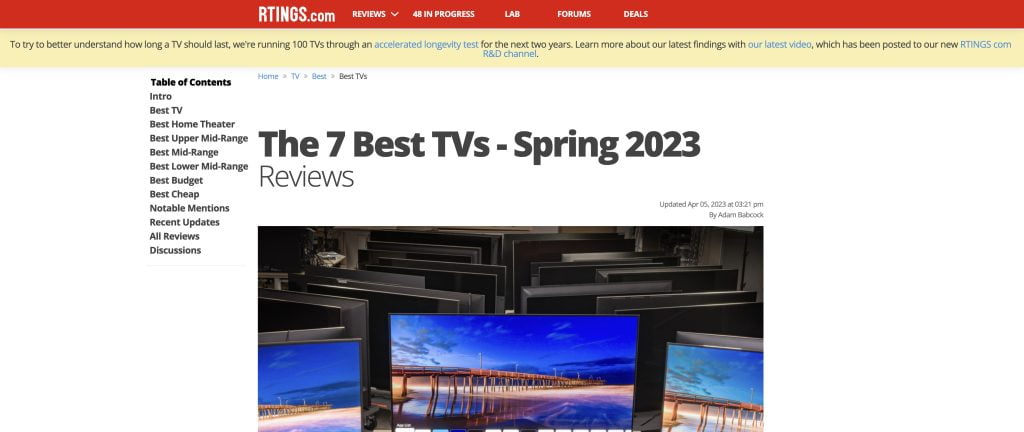
RTINGs undoubtedly tests their TVs. Their comprehensive scoring breakdowns and heavy use of quantitative tests in their reviews (plus willingness to provide proof of them) earn them their high Trust Score.
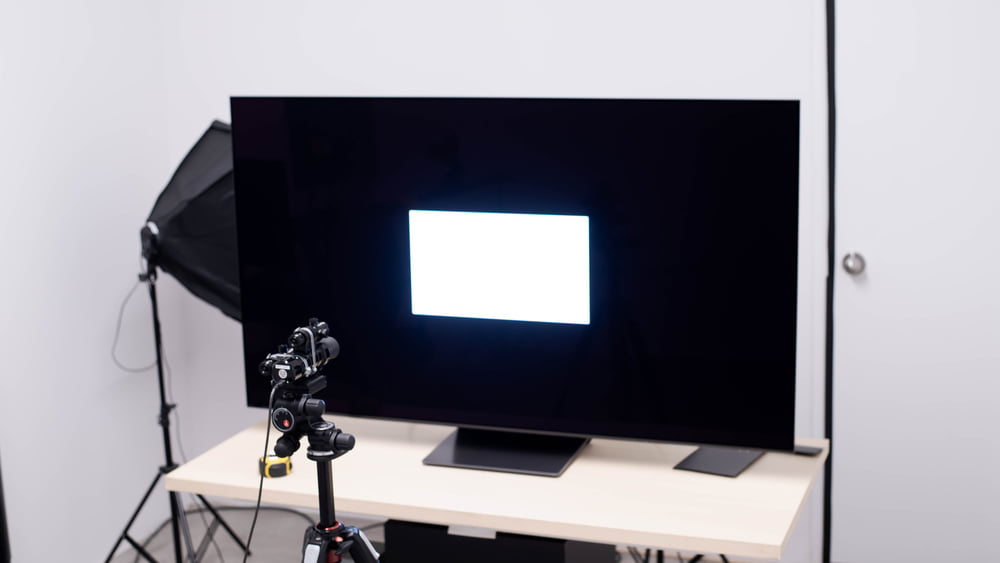
They have elaborate TV testing methodologies for every performance criteria, which is something we’ve never seen done before in the electronics review industry. They provide numerous real photos of the TVs and testing equipment, and they use correct units of measurements in their test results.
Their video reviews have the reviewers speak in front of the camera as well for further transparency.
Publication #2: PC Mag
- Parent Company: Ziff Davis
- Type of Site: Multiple Tech Review
- TV Trust Score: 91.40%
- Total #1 Ranked TV Keywords: 611
- Monthly TV Traffic: 180,100
- How they earn their money: Affiliate programs, ads, sponsored posts, paid traffic
Testing Quality Analysis:
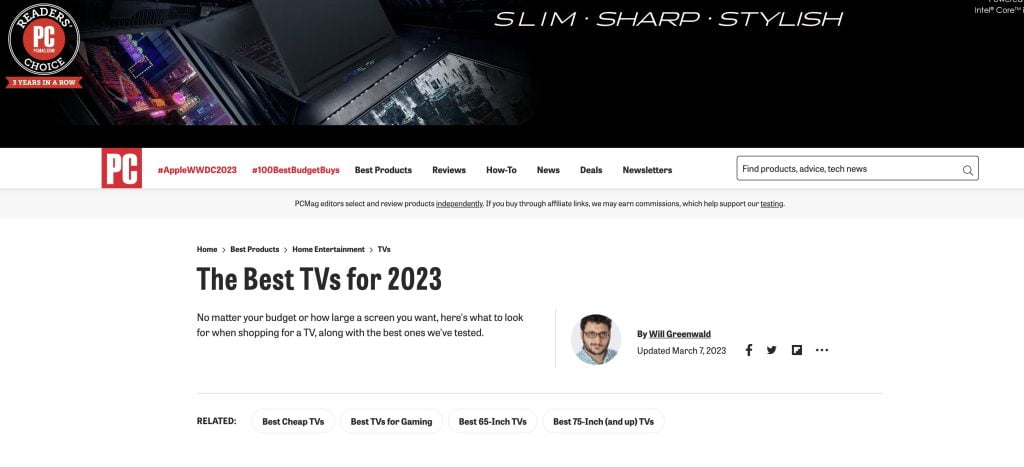
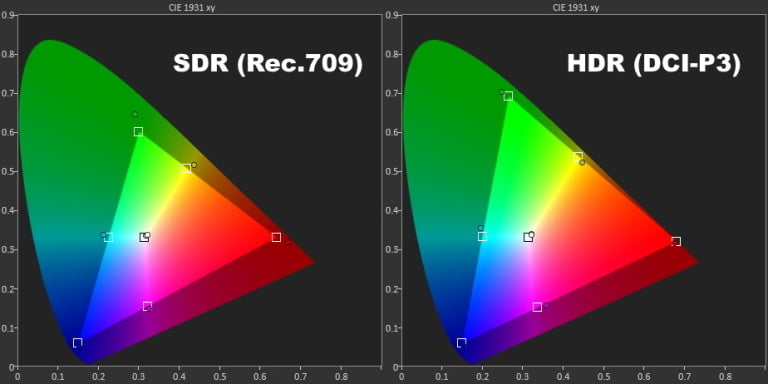
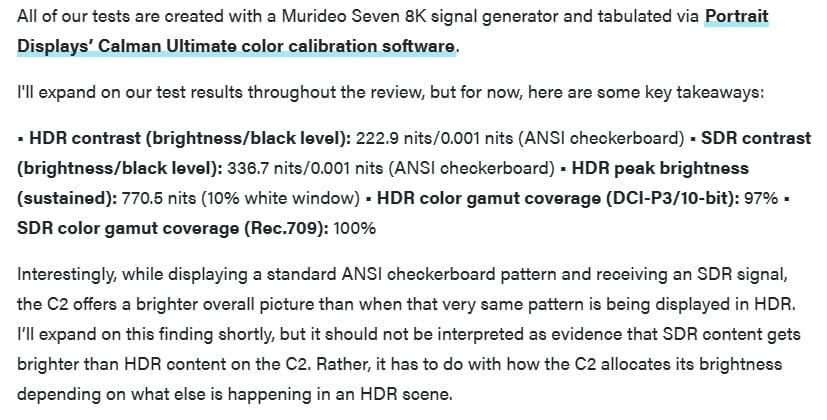
PCMag engages in proper testing in their reviews with a clearly defined (though not completely explained) testing methodology that values quantitative testing over qualitative. They employ multiple pieces of equipment, test everything they review, and present their results within graphs such as this color gamut graph, earning them a high score.
They provide test results of all four custom questions we were looking for for the TV review category, so they know what TV performance criteria are most important to evaluate for a consumer.
The only question they missed was a bonus question looking for recently-published video reviews, which can take their excellent reviews even further.
Publication #3: CNET
- Parent Company: Red Ventures
- Type of Site: Multiple Tech Review Site
- TV Trust Score: 89.00%
- Total #1 Ranked TV Keywords: 2,039
- Monthly TV Traffic: 399,600
- How they earn their money: Affiliate programs, ads, sponsored posts, and paid traffic
Testing Quality Analysis:
CNET has dedicated testing equipment that it shows off in their reviews, dedicated testing setups (including whole rooms designed to help test TVs) and they provide clear explanations of their performance criteria, testing methods, and scoring breakdowns.
Their support for their testing methodology includes their use of quantitative testing methods, as well as providing pictures and videos of how they test and what they test.
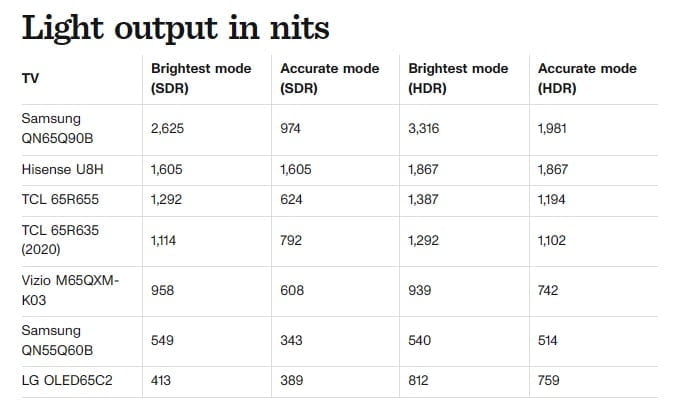
Their comparison tables are great ways of communicating useful information gained through testing for the consumer, while also providing proof you’re doing your due diligence.
Sign up for our Newsletter!
Keep up with more Top 10 Testers in future Trust Lists coming soon.
Publication #4: Sound and Vision

- Parent Company: AV Tech Media
- Type of Site: Multiple Tech Review
- TV Trust Score: 85.20%
- Total #1 Ranked TV Keywords: 99
- Monthly TV Traffic: 866
- How they earn their money: Affiliate programs, advertisements, and sponsored posts
Testing Quality Analysis:
They test key Performance Criteria with the proper units of measurement. They also assign scores to Categories of Performance in their reviews to provide a clear, granular final evaluation of the products.
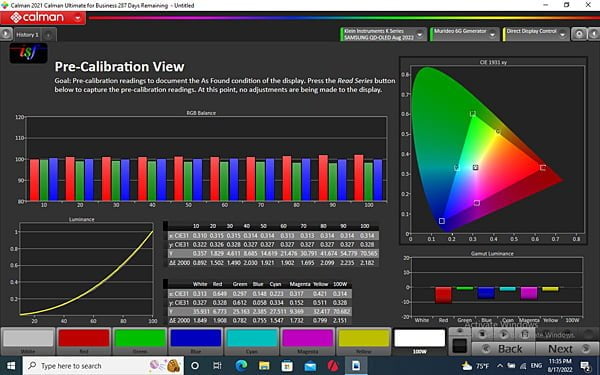
They document test benches and provide video review content. Full captures of software like to the right are great ways of helping to bolster their testing claims. On the other hand, it would be great to see real photos of the TVs they test along with testing equipment.
They earned a low General Score aside from the Category Score that are calculated into the overarching Trust Score, so improving the overall transparency of their publication would raise their final Trust Score.
Publication #5: Trusted Reviews
- Parent Company: Incisive Media
- Type of Site: Multiple Tech Review
- TV Trust Score: 81.20%
- Total #1 Ranked TV Keywords: 128
- Monthly TV Traffic: 29,600
- How they earn their money: Affiliate programs, ads, and sponsored posts
Testing Quality Analysis:
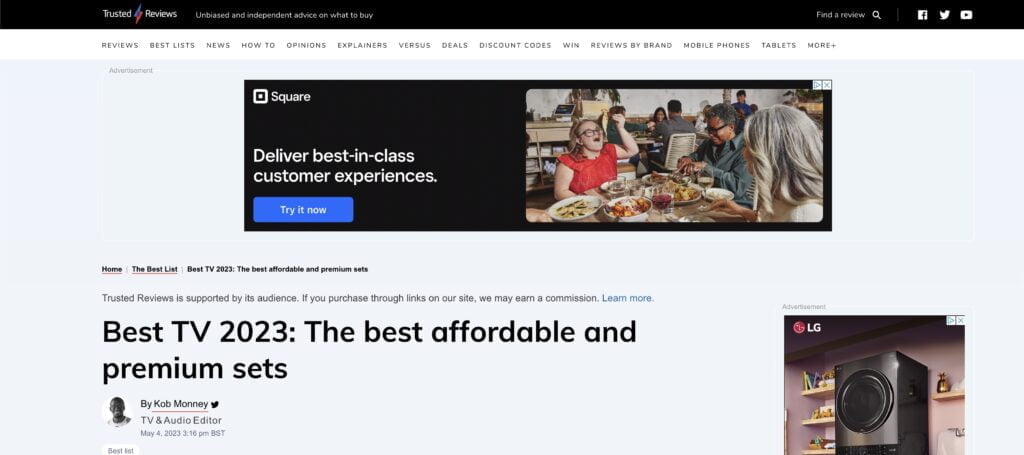
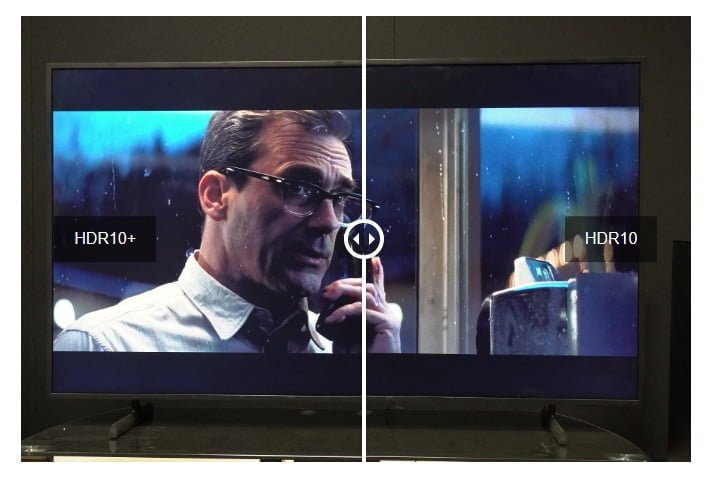
They provide an outline of testing methods, equipment, and performance criteria, as well as how the scoring is broken out and weighted. Trusted Reviews features many real photos of these TVs. The reviews cover most of the custom questions we were looking for, except for one regarding contrast.
To improve their score further, it’d be great to see more real photos that features test equipment, software test screenshots, etc. Trust Reviews also has a lower General Score, so adding some missing features such as an in-depth scoring system can help out their TV Trust Score further.
Publication #6: Tom’s Guide
- Parent Company: Future PLC
- Type of Site: Multiple Tech Review
- TV Trust Score: 77.80%
- Total #1 Ranked TV Keywords: 1,587
- Monthly TV Traffic: 377,500
- How they earn their money: Affiliate programs, ads, and sponsored posts
Testing Quality Analysis:
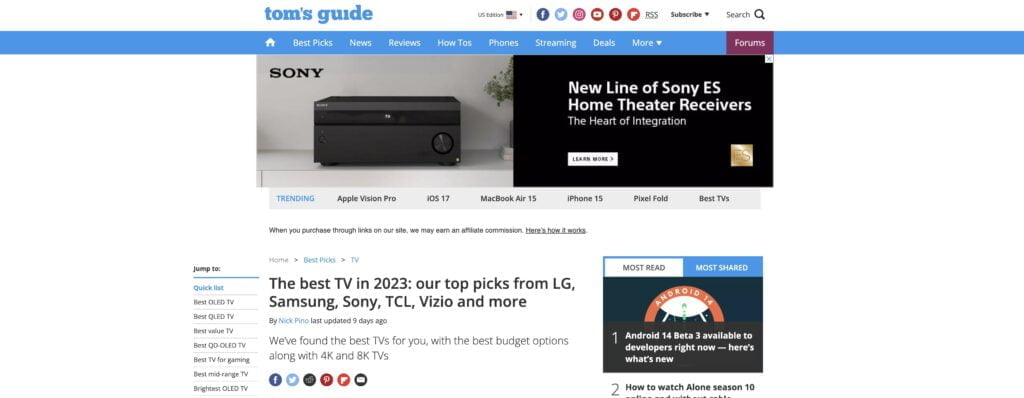
Their reviews feature visual evidence of the products and they have a TV testing page, though it could use a refresh. It’s over four years old, which isn’t as helpful to consumers since technology is constantly evolving year after year.
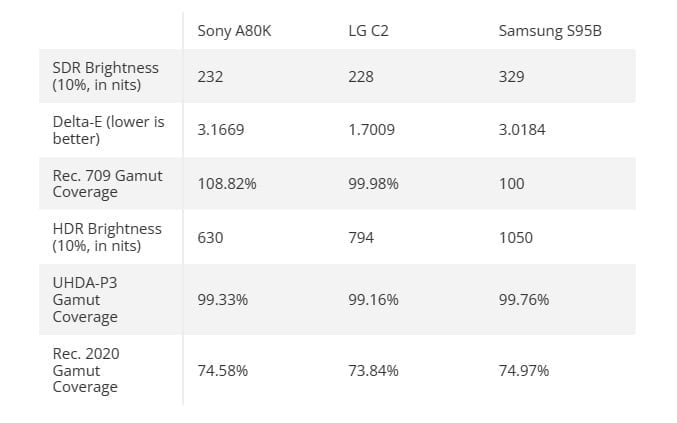
Tom’s Guide test several core Performance Criteria except for contrast. They presents their findings in helpful comparison tables as well.
Their General Score is a big factor in what lowered their TV Trust Score below the others in the top 10. They could be more transparent in certain areas, such as their ethics via an ethics statement and their ratings of categories of performance, usage cases, and performance criteria.
Publication #7: Wirecutter

- Parent Company: The New York Times
- Type of Site: Multiple Tech Review
- TV Trust Score: 75.00%
- Total #1 Ranked TV Keywords: 1,342
- Monthly TV Traffic: 144,400
- How they earn their money: Affiliate programs and user subscriptions
Testing Quality Analysis:
Their TV testing methodology, real images of the TVs, and quantitative measurements help their Trust Score out a lot. They have a decent trustworthy General Score thanks to their ethics statement and comparison tables, but they could benefit from an in-depth scoring system to bring further clarity to their final verdicts on products.
On the Category side of the questions, they missed an opportunity to provide test results of contrast. Their buying guides appear rather text heavy, so we’d suggest images of testing equipment to space out the text.
They can also embed a recent review video into the text, which we couldn’t find during our evaluation.

Publication #8: Reviewed

- Parent Company: Gannett
- Type of Site: Multiple Tech Review
- TV Trust Score: 74.20%
- Total #1 Ranked TV Keywords: 781
- Monthly TV Traffic: 56,200
- How they earn their money: Affiliate programs, ads, sponsored posts, and paid traffic
Testing Quality Analysis:
What is tested and how, as well as equipment used, is discussed, but only briefly. There is a focus on quantitative tests, though the assignment of “best” is not clear in their discussion because of a lack of scoring.
One can tell that the pictures are authentically theirs thanks to the “Reviewed” LED neon sign in the background of most of them. To further break up the text, tables would be nice to see. For some variation in the TV photos and to add to their Trust Score, photos featuring test equipment would be helpful.
Publication #9: Gamesradar
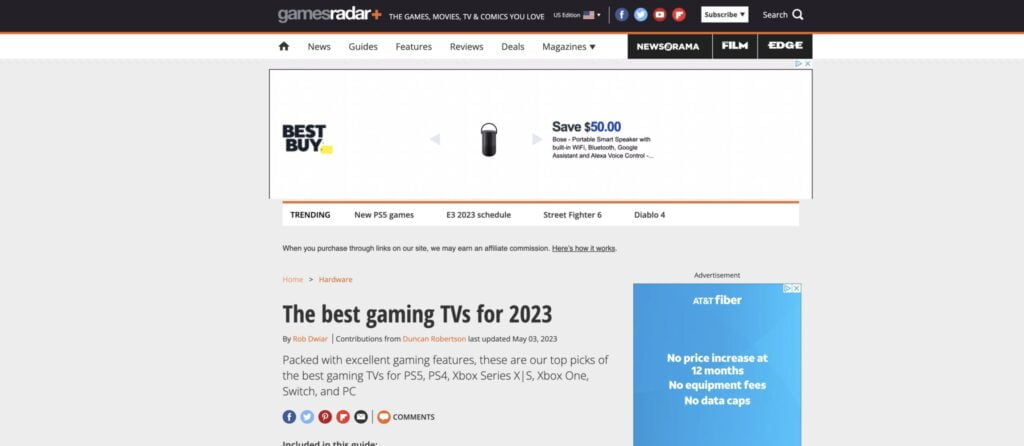
- Parent Company: Future PLC
- Type of Site: Multiple Tech Review
- TV Trust Score: 73.80%
- Total #1 Ranked TV Keywords: 156
- Monthly TV Traffic: 31,600
- How they earn their money: Affiliate programs, ads, and sponsored posts
Testing Quality Analysis:
They provide a TV testing page, real images, and quantitative measurements, so they tested TVs to a certain degree, but we wish their testing was more thorough in regards to Performance Criteria.
They don’t have many images of software test screenshots or testing equipment. Though they answered some custom questions, they missed the other half that regard brightness and contrast.
Gamesradar uses a simple five star rating system, so utilizing a more in-depth scoring system down the road would also improve their Trust Score.

Publication #10: TV Findr
- Parent Company: No parent company found + No investors found
- Type of Site: Niche Tech Review
- TV Trust Score: 72.00%
- Total #1 Ranked TV Keywords: 43
- Monthly TV Traffic: 12,500
- Do they claim to test TVs?: Yes
- Do they have a TV Testing Methodology?: No
- How they earn their money: Affiliate programs
Testing Quality Analysis:
- Do they claim to test TVs?: Yes
- Do they have a TV Testing Methodology?: No
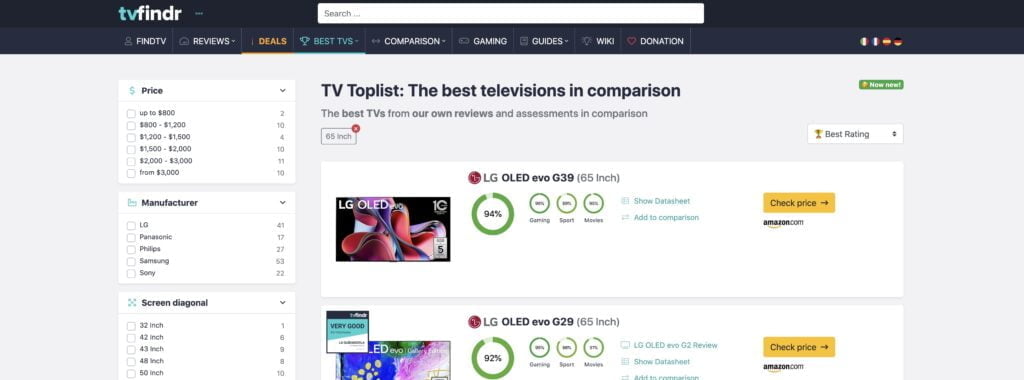
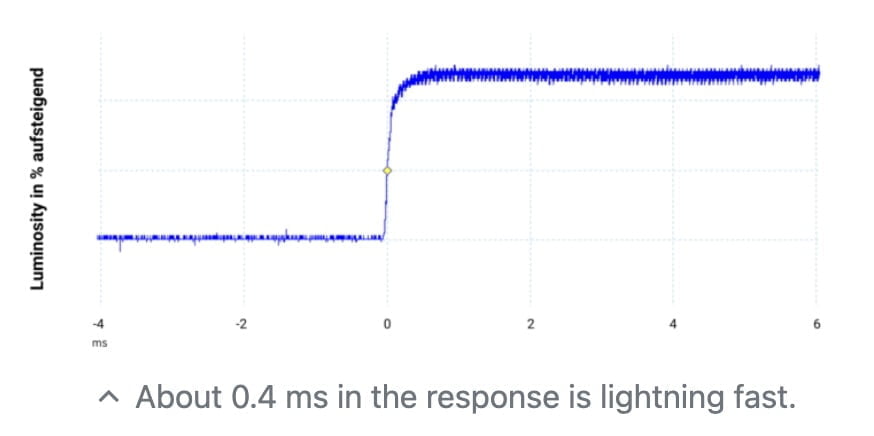
TVFindr definitely tested these TVs. They provide several real photos of the TVs along with graphs of their test data in their reviews. They covered all of our custom questions we had and even score individual performance criteria and usage cases, which we rarely see!
However, on the other hand, their buying guides are filled with stock images and lack comparable testing data which aren’t nearly as helpful as their single reviews. They could also benefit from an organized TV testing methodology page that applies to all their reviews and explains a consistent testing process along with the names of the equipment they use.
They could use an About Us page as well to provide more transparency on who the people are behind these great TV reviews.
As noted above, we’ve classified each site in the 1,613 search results by its type, like Multiple Tech Review, Niche News, General E-Commerce, etc. Here are their definitions and examples:
TYPE OF SITE
DEFINITION
EXAMPLES
Multiple Tech Review
A site that covers more than 15 product categories such as a broad range of product categories from beauty and tech to kitchen and car products.
1. PC Mag
2. Best Products
Niche Tech Review
A site with 3-15 product categories. They cover many products in a particular space (such as automotive).
Hyperniche Tech Review
A site that reviews 1-2 product categories. They evaluate a tighter scope of products, so they might only review running shoes or VPNs or vacuums and so forth.
1. Top10VPN
2. Brick Fanatics
Consumer Review
They are not a product retailer, and their main purpose is to let consumers post their own reviews of products or businesses
1. G2
2. Trust Pilot
General News
Their navigation bar leads with “News”, and less than 10% of their content is affiliate. They cover a broad range of news topics.
Niche News
Their navigation bar leads with “news” & less than 10% of their content is affiliate. Their content is focused on a particular space (tech, business, etc.)
1. Mac Rumors
2. Apple Insider
3. Forbes
4. Electrek
General eCommerce
Their navigation leads with their retailer pages. Less than 15-20% of their content is affiliate. They sell a broad range of product categories.
Niche eCommerce
Their navigation leads with their retailer pages. Less than 15-20% of their content is affiliate. They sell 2-4 types of products that belong under a similar sphere.
1. BTOD
All TV Trust Scores Ranked_
For those curious about all the sites we evaluated and what Trust Score they received, here’s the entire list of researched TV review publications in order of best Trust Scores to the bottom of the barrel.
| ???? Alright, the TL:DR SparkNotes of our investigation is over. In short, the online TV review landscape is littered with an enormous amount of unreliable reviews, so they’re difficult to steer clear of, but that just makes the few thorough, legit testers stand out as diamonds in the rough. If you’ve got additional time, we encourage you to keep reading the full analysis of our entire investigation, including: ● The shocking truth behind the 12 publications raking in big bucks with their deceiving, surface-level TV content. It gets even worse that they claim to test their TVs but actually do not. ● Our solution to helping consumers get the most accurate TV model ratings (all in one place!) based on the best testers’ scores and legit customer ratings–which we call True Scores. |
The Two Problems Online Shoppers Face_
| TLDR: Many experts don’t really test the product, plus many consumer reviews provide unreliable information (some are not even reflective of the product but other aspects). |
Consumers face trouble on both the expert and customer review sides when trying to make a purchase decision. Remember that our findings discovered how you have a 1 in 2 chance of running into an unreliable review and that one-third of the search results come from a misleading site that claims to test but does not.
These shady practices distort the information pyramid, tilting it away from the consumer in favor of big business and unscrupulous review peddlers.
And you can’t ignore the voice of the people. Customer reviews matter as well when it comes to understanding how good a product really is.
KEY STATISTIC
87% of consumers say that ratings and reviews posted by real-life customers have a greater impact on their purchasing decisions.
Emplifi, “Meeting the Demands of the Modern Customer” December 2022 Study
Customer reviews/ratings have become the most influential factor in purchasing decisions – outranking price, return policy, and shipping costs.
But in today’s world of fake reviews, customer ratings aren’t as safe to rely on as they should be. “One tap” reviews of just stars and no substance are easy to fudge. A lot are missing details on long-term usage of a product. And even if a review isn’t faking it, many of them are born out of apathy.
Frankly, we’ve had enough of a system that wants us to believe it’s OK to live in a game rigged against us, and we’re committed to driving change.
Our Solution To Fix This Problem_
Our commitment, our big “why,” is to expose the fake reviewers and reward the true testers through transparency and cooperation. Too many review sites are just a house of cards. We want to blow them down and give you the tools to make the best choices on the products you want.
Here’s how we do it:
- Identify which publications actually do testing.
- Look for authentic, long-term customer reviews.
Then, we distill that information down to what really matters so you can make an informed decision.
We understand that our investigation’s findings may rustle some feathers, but this is all for the sake of the consumers. We want to call in every single publication that publishes for TV reviews for more transparency and testing in the online review landscape.
What The Testers Need To Be Testing_
So how does one measure and determine how “good” a TV is? Through evaluating its performance, which refers to the product’s ability to deliver optimal results and meet or exceed expectations in terms of its intended functionality, efficiency, and effectiveness.
There’s no one thing that makes a particular TV or product good too. It’s a combination of several different factors called Performance Criteria (PC), and each has a unique impact on a given product’s performance. Multiple Performance Criteria make up a single Category of Performance (CP).
1. Category of Performance – An encapsulation of related Performance Criteria to evaluate the overall performance of a product in a certain category. The right criteria must be selected to properly assess a Category of Performance.
2. Performance Criteria – An individual standard, measurement, or benchmark used to evaluate and assess the performance of a product for a specific use or purpose.
Examples:
- Electronics i.e. TVs ????, Smartphones ????, Laptops ????
- CP: Display/Picture Quality
- PC: Resolution, color accuracy, brightness, contrast ratio, viewing angles.
- CP: Sound Quality
- PC: Clarity, volume range
- CP: Display/Picture Quality
- Appliances i.e. refrigerators, washing machines, vacuum cleaners
- CP: Energy Efficiency
- PC: Energy consumption, Energy Star rating
- CP: Durability
- PC: Lifespan, resistance to wear and tear
- CP: Energy Efficiency
To accurately compare different models against each other, it’s important to test the same Performance Criteria across a category. So, we’ve identified the various Performance Criteria that make up each Category of Performance for TVs and compiled them into one comprehensive list.
Note: Although “value” is important to us, there isn’t a test for value. Value is a subjective judgment call that gets made (or doesn’t get made) by a tester. We do not give any tester a leg up for deciding to include value as part of their criteria. It doesn’t hurt them, but it won’t help them.
Quantitative Vs Qualitative_
Part of our examination and analysis includes a look at quantitative and qualitative testing. While some things simply can’t be measured (like local dimming and how it appears to the human eye), many things can be. As such, we value quantitative tests with clearly defined methods and units of measurement.
While we still consider qualitative tests based on how a tester feels about a feature, we know that quantitative testing provides a more comprehensive picture of a product’s performance.
TV Categories of Performance & Performance Criteria
We were looking for test results of TV-specific Categories of Performance and Performance Criteria, such as:
- Picture Quality (CP)
- Color Gamut (PC)
- Contrast Ratio (PC)
- Brightness (PC)
- Input Lag (PC)
For the full list of TV Categories of Performance and Performance Criteria along with their units of measurement and testing equipment, they’re all listed in the TV Testing Methodology.
How We Test The Testers_
Before we can start handing out True Scores to great and not-so-great TVs, we need to identify the most trustworthy experts on the internet. The Trust Score is the bedrock of our True Score system. They are used to determine the Expert Score for a product which helps calculate its True Score.
This process is not automated. We hire real people to visit each publication and conduct a thorough inspection to determine if they’re really testing these products.
You can learn more about all of the individual questions that go into our Trust Scores here.

The product True Scores are calculated using a Bayesian model, which is a type of probabilistic model. In a Bayesian model, beliefs and uncertainties are expressed in terms of probabilities. We get that statistics aren’t everyone’s forte so we explain the Bayesian model as simply as possible when we discuss how we test the testers.
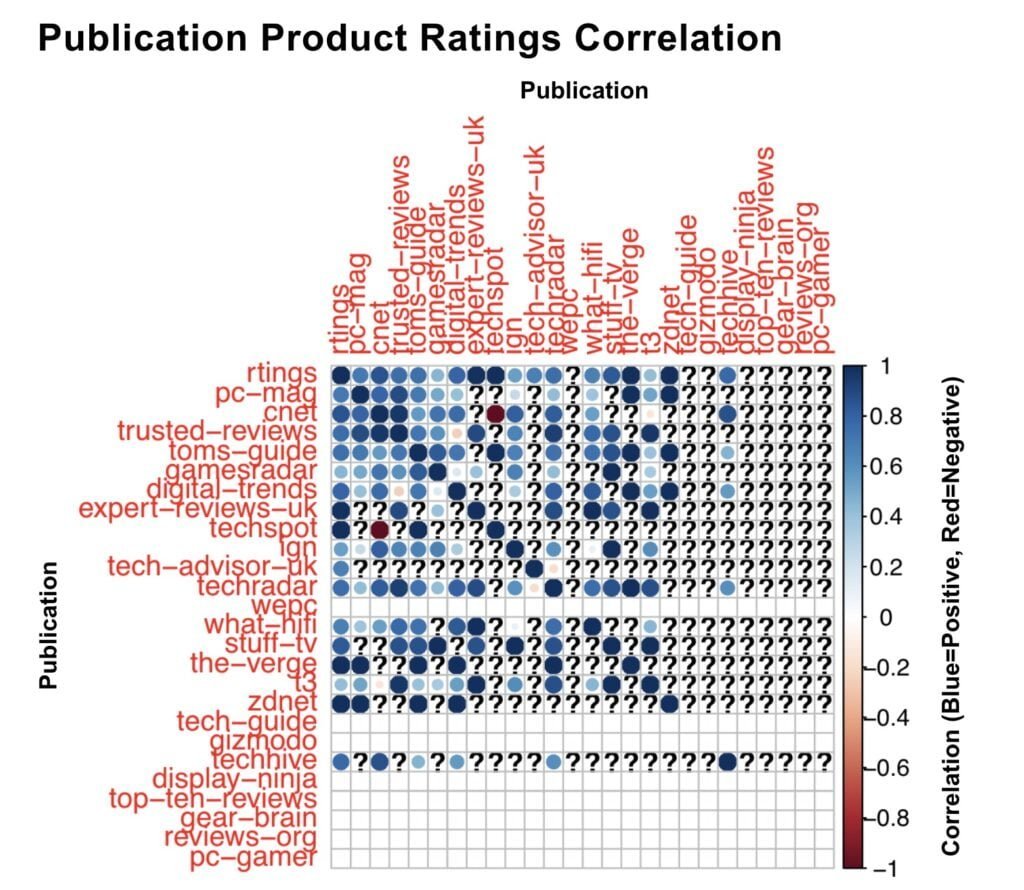
We had our entire True Score system validated by a professional statistician. He even found correlations between our top scoring TV testers’ expert product reviews, which can suggest that those thorough testers (those with high TV Trust Scores) have consistency and methodological agreement in their product testing.
Check out the following chart that illustrates which publications strongly correlate with each other based on product ratings. Most pairings positively correlate, while a few have negative correlations.
Here is a scatter plot illustrating our top two trusted sites’ product ratings. You can see that they correlate positively together.
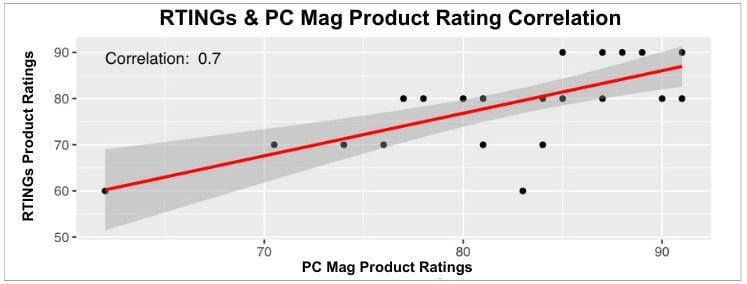
To be clear, correlations in general are not necessarily definitive, but we can draw valuable insights from them. So this is a great sign that we’re on a path to effectively identify publications that engage in more thorough testing practices.
The Dirty Dozen Who Can’t Be Trusted_
Let’s talk about the publications in the following list that didn’t make the cut. We were disappointed with them since they say that they claim to test TVs but they received a failing trust score under 60%.
The following list of 12 publications is in descending order of who is ranking #1 (aka winning most of the traffic on the SERP) for the most TV keywords. These keyword market shares were identified in mid-May of 2023.
Publication #1: Lifewire
- Parent Company: Dotdash Meredith
- Type of Site: Multiple Tech Review
- TV Trust Score: 48.40%
- Total #1 Ranked TV Keywords: 1,405
- Monthly TV Traffic: 142,900
- How they earn their money: Affiliate programs, Advertisements, Sponsored posts
- Monthly TV Traffic: 142,900
Testing Quality Analysis:
- Do they claim to test TVs?: Yes
- Do they have a TV Testing Methodology?: No
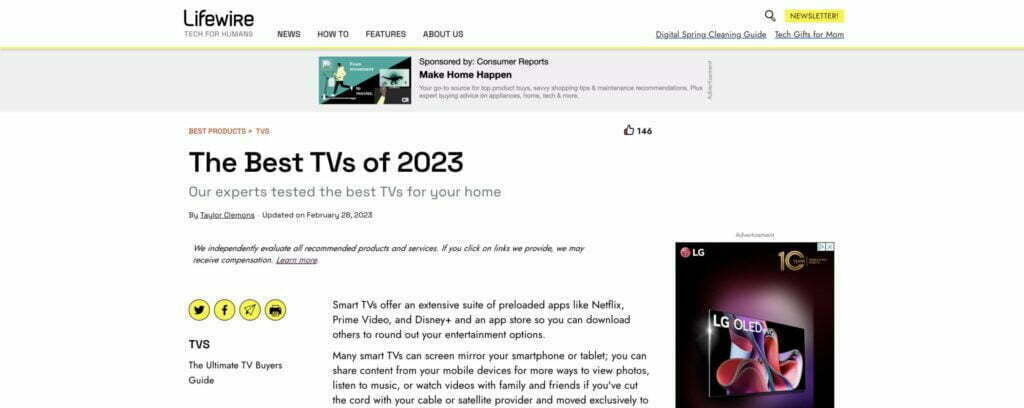
They describe their experience using the TVs, like exploring the different models. They claim to test but nothing that’s provided in their write ups indicates proper, effective testing was performed.
While there are photos that help to confirm that Lifewire did actually have the televisions in the presence of the reviewers (their original photographs help support this) they do not have any kind of measurements that would help support their claims of testing.
Additional charts and graphs would make these reviews more convincing. None of the custom questions we’ve laid out are addressed in the three reviews we sampled, which means there’s no hard numbers or data/graphs for input lag, peak brightness, color gamut or contrast.
Publication #2: The Product Analyst
- Parent Company: N/A
- Type of Site: Niche Tech Review
- TV Trust Score: 26.00%
- Total #1 Ranked TV Keywords: 1,192
- Monthly TV Traffic: 58,400
- How they earn their money: Affiliate programs, Advertisements
Testing Quality Analysis:
- Do they claim to test TVs?: Yes
- Do they have a TV Testing Methodology?: No
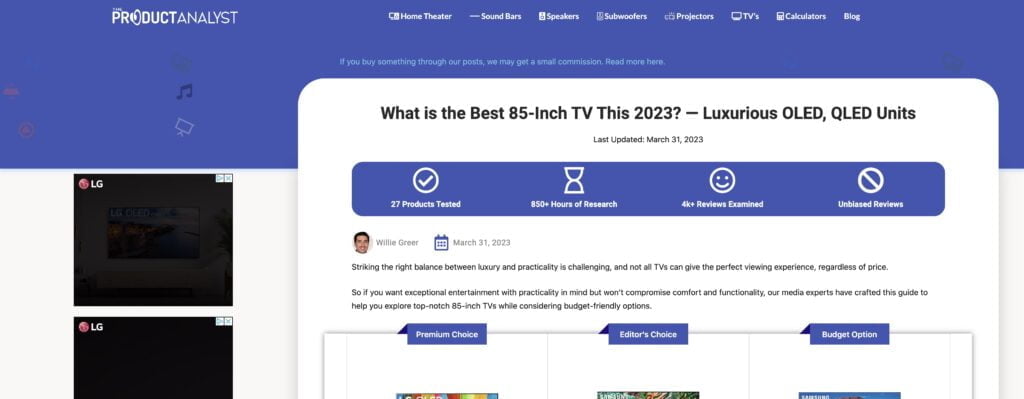
Though they provide real images of the TVs (so they definitely used the TVs) we’re not convinced that they actually tested them. There’s no visual proof of the testing equipment, comparable TV models side-by-side, nor test results in the form of charts, screenshots, etc.
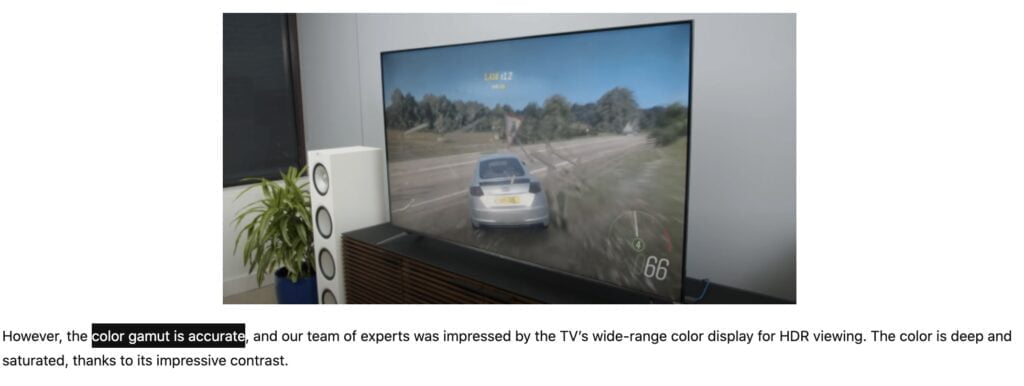
We couldn’t locate any quantitative test results of the major TV performance criteria we were looking for. It’s nice that they briefly mentioned a usage case though, such as low input lag being a benefit to gamers. But all these descriptive words of quantifiable criteria aren’t convincing without the test results.
What does it mean that brightness isn’t “up to par”? Why is the color gamut “accurate”?
Publication #3: Reviews.org
- Parent Company: Clear Link Technologies, LLC
- Type of Site: Multiple Tech Review
- TV Trust Score: 20.60%
- Total #1 Ranked TV Keywords: 1,112
- Monthly TV Traffic: 95,100
- How they earn their money: Affiliate programs, Advertisements, Sponsored posts
Testing Quality Analysis:
- Do they claim to test TVs?: Yes
- Do they have a TV Testing Methodology?: No
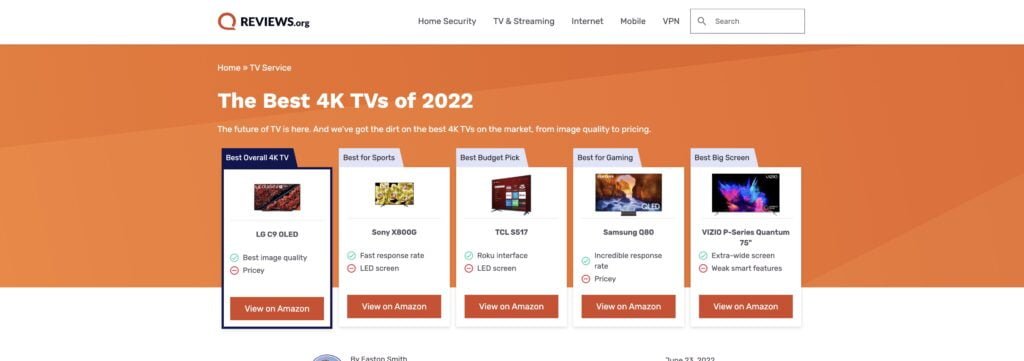
Right off the bat, we couldn’t find many TV product reviews to discuss specific models in depth. The sole product review we found has real photos, but like The Product Analyst, Reviews.org doesn’t provide any test results despite claiming to test TVs.
No TV test methodology exists either so things aren’t looking too good for their testing claims. The author explains certain specs and new technologies about a particular TV, but what does this all mean for the actual performance of the TV? Adding test results would shed better light on the actual quality of the TV.

Publication #4: Make Use Of

- Parent Company: Valnet Inc.
- Type of Site: Niche News
- TV Trust Score: 29.80%
- Total #1 Ranked TV Keywords: 900
- Monthly TV Traffic: 106,800
- How they earn their money: Affiliate programs, Advertisements, Sponsored posts
Testing Quality Analysis:
- Do they claim to test TVs?: Yes
- Do they have a TV Testing Methodology?: No
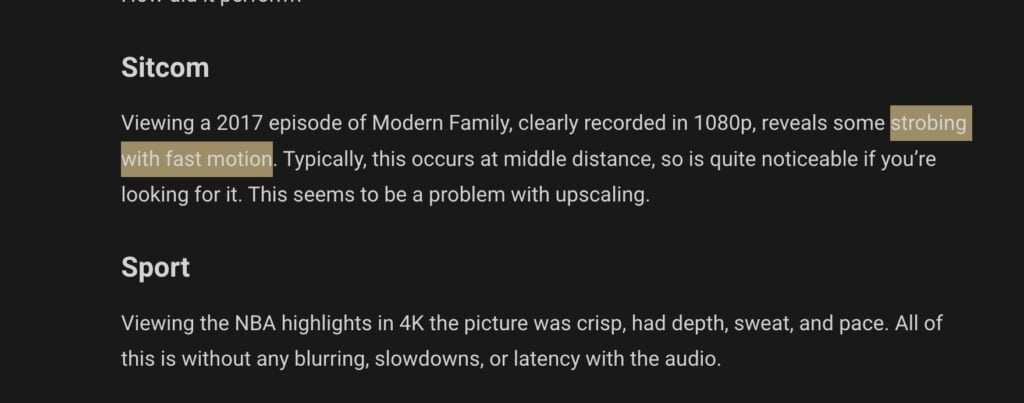
They definitely use these TVs for their reviews, but “testing” seems to be a stretch. The visual evidence of that aspect is there, but we’re missing proof on any testing equipment or results.
The review is filled with qualitative assessments of the TVs, but if you’re after test results about the TV performance criteria that matter, you should probably look elsewhere.
It’s great how they used the TV for various usage cases like watching sports, playing games, etc., but they don’t defend these descriptive claims of the TV’s performance with quantitative tests.
Publication #5: Consumer Reports
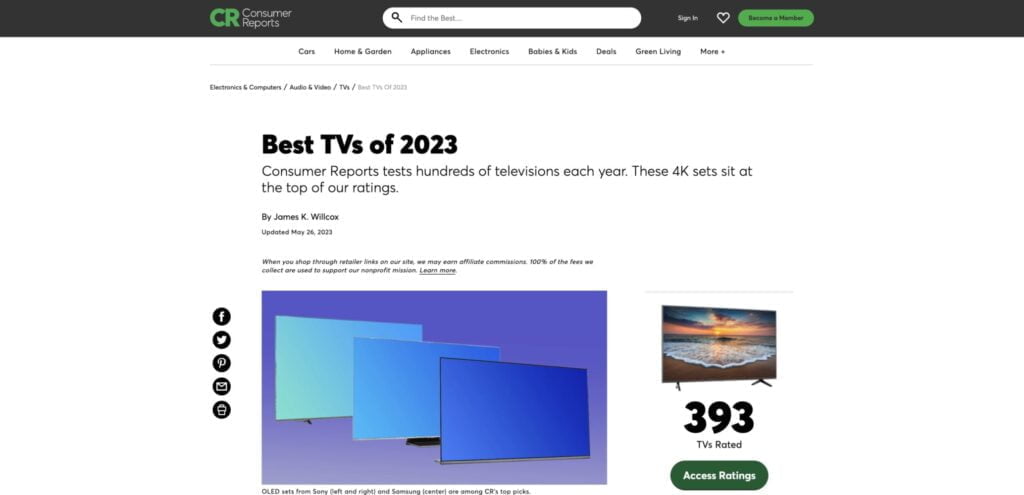
- Parent Company: N/A
- Type of Site: Multiple Tech Review
- TV Trust Score: 35.40%
- Total #1 Ranked TV Keywords: 761
- Monthly TV Traffic: 102,600
- How they earn their money: Affiliate programs, User subscriptions, Investors (Note that they’re a non-profit*)
Testing Quality Analysis:
At the time of this report, we’ve reached out to Consumer Reports for actual test results and units of measurement.
They say they test, but there’s little evidence provided to show it. Worse still, the paywall is a barrier to entry. Scoring system is a breakdown of multiple criteria, which is good. Their results section on their reviews is decently sized, with ratings given to multiple criteria, but there are no photos, graphs or charts to help confirm to the reader that the testing they claim to do was actually performed.
They provide a “detailed results” section that uses qualitative language instead of quantitative data to drive their points, so instead of seeing a color gamut graph or contrast screens, we just get statements saying brightness is “very good” or contrast is “excellent.”
* A “Non-Profit” is an organization that operates for purposes other than generating profit.
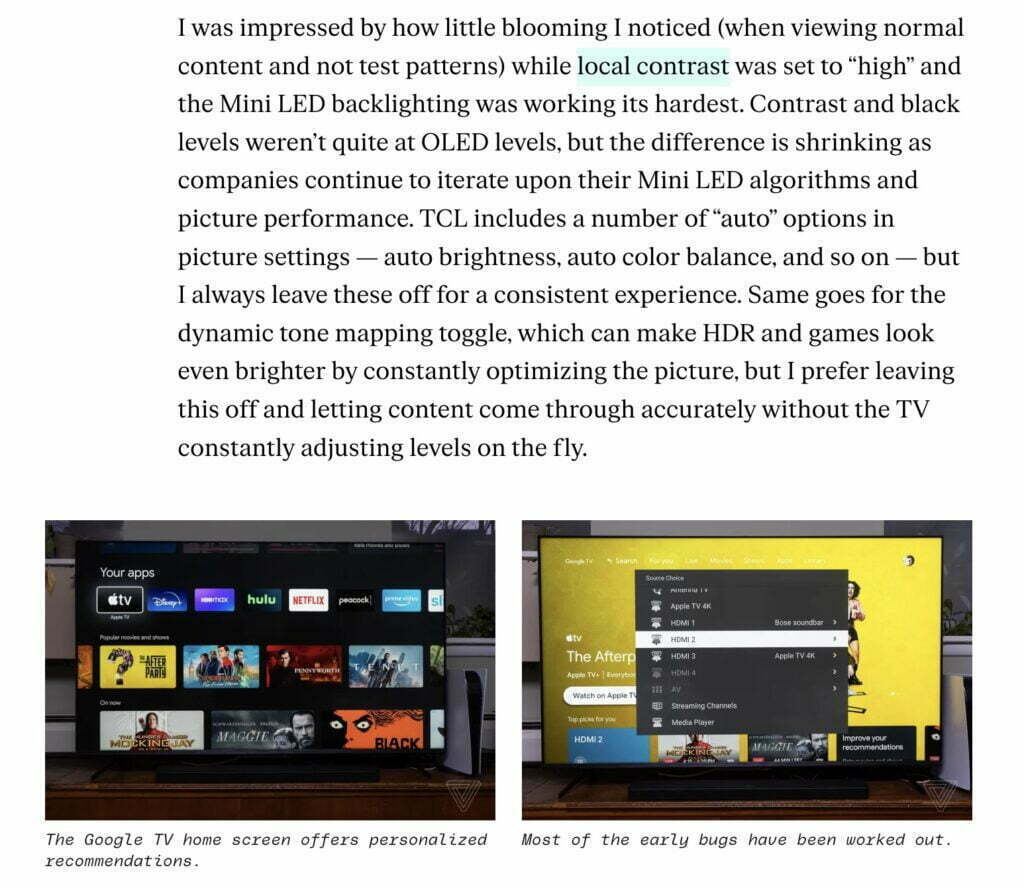
Publication #6: The Verge

- Parent Company: Vox Media
- Type of Site: Niche News
- TV Trust Score: 34.40%
- Total #1 Ranked TV Keywords: 706
- Monthly TV Traffic: 51,800
- How they earn their money: Affiliate programs, Advertisements, Sponsored posts
Testing Quality Analysis:
- Do they claim to test TVs?: Yes
- Do they have a TV Testing Methodology?: No
We don’t deny that they actually had the TVs in front of them and used them, for their real images clearly prove that. However, their content does not include images showing hardware testing equipment, screenshots of test results, etc. This absence raises concerns about the thoroughness of their testing process.
The lack of transparency regarding their testing methods and tools further undermines their credibility. Though they describe their impressions of important performance criteria like contrast and color quality, their quantitative test results to support their claims are nowhere to be found.
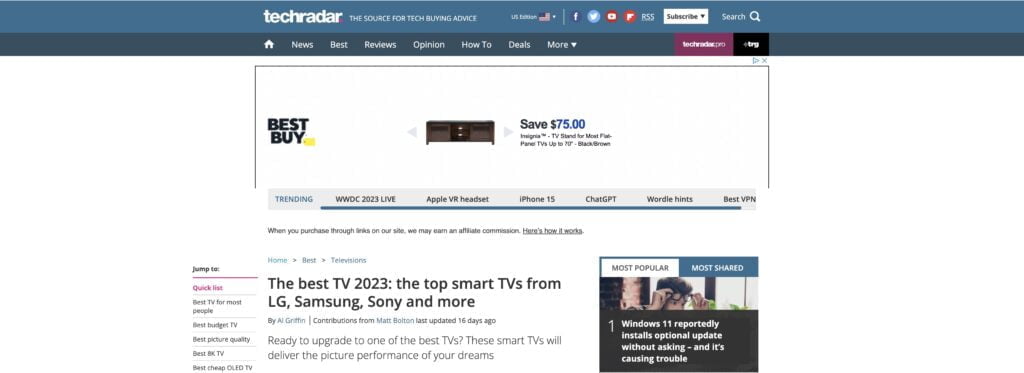
Publication #7: TechRadar
- Parent Company: Future PLC
- Type of Site: Multiple Tech Review
- TV Trust Score: 56.60%
- Total #1 Ranked TV Keywords: 689
- Monthly TV Traffic: 253,600
- How they earn their money: Affiliate programs, Advertisements, Sponsored posts
Testing Quality Analysis:
- Do they claim to test TVs?: Yes
- Do they have a TV Testing Methodology?: No
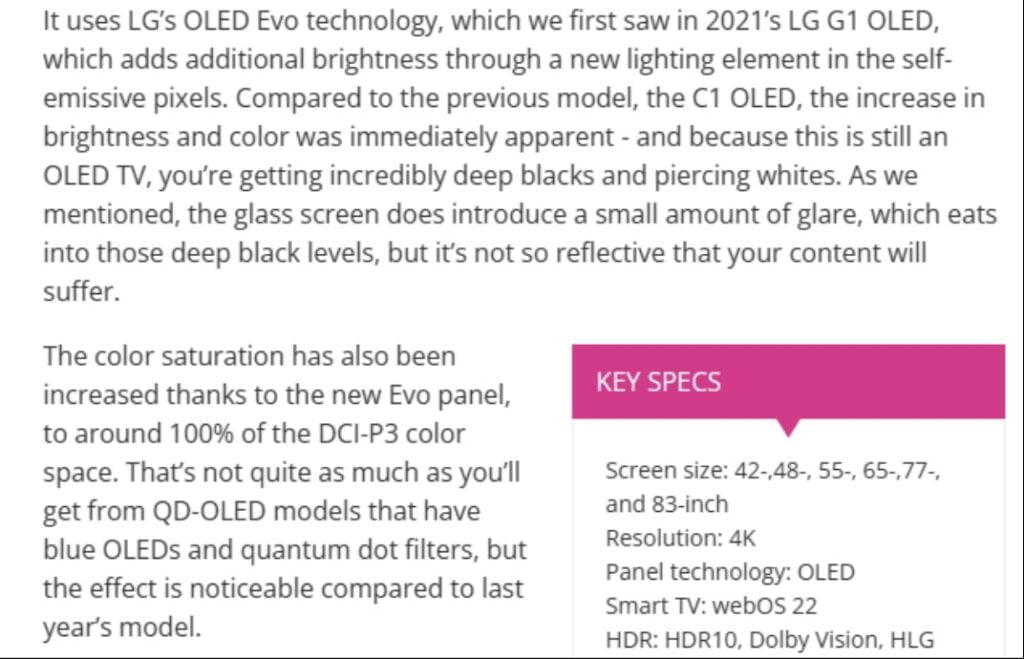
TechRadar’s failing score is owed in part to their claims of testing on their TV reviews, which is only sometimes true. Though one of the three reviews sampled included measurements for input lag (in ms) and peak brightness (in nits), these measurements were absent from other two reviews, along with answers to the remaining two custom questions (color gamut and contrast.)
We don’t doubt that TechRadar actually got the televisions, based on their photos, but their testing leaves a lot to be desired on some of their reviews. Inconsistency creates a problem for the consumer, as it becomes difficult to know if a review is going to be well made and the product of careful testing or not.
Publication #8: CNN
- Parent Company: Warner Bros. Discovery
- Type of Site: General News
- TV Trust Score: 32.40%
- Total #1 Ranked TV Keywords: 517
- Monthly TV Traffic: 66,300
- How they earn their money: Affiliate programs, Advertisements, Sponsored posts
Testing Quality Analysis:
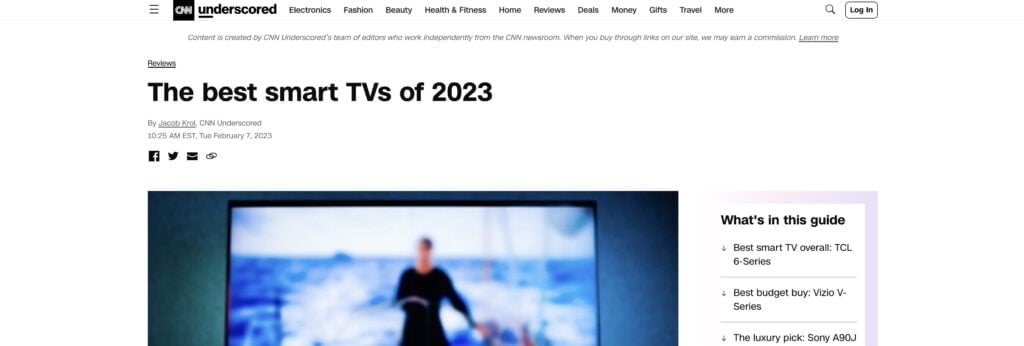
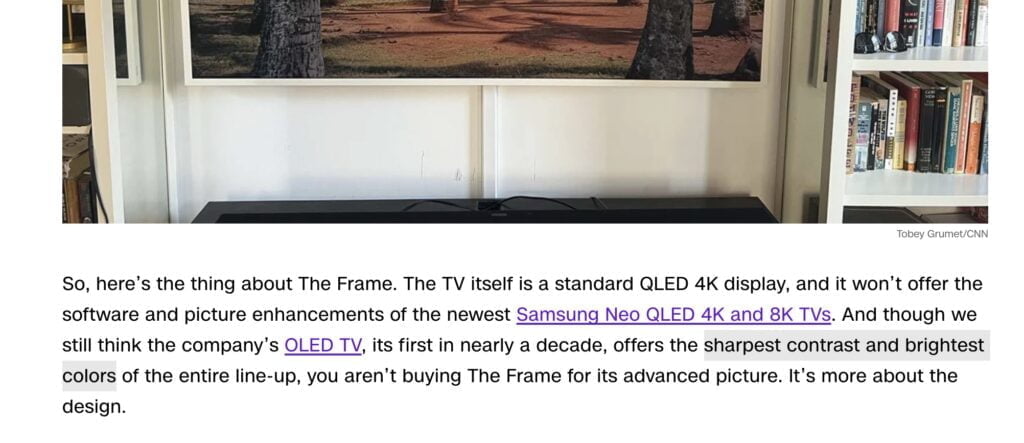
They certainly used these TVs, but their testing claims are rather weak. In their reviews, they have multiple real photos of the TVs. One features a real person mounting the TV, but we realize in the review that that person is the hired installer, not the author.
CNN does provide a TV testing methodology, but the actual reviews lack quantitative testing evidence. They do discuss certain criteria, though they forgot about input lag. They compare the model to other TVs, which is a great concept, but test results would support why the author thinks one is better than the other for certain criteria.
Publication #9: Forbes
- Parent Company: Integrated Whale Media Investments
- Type of Site: Niche News
- TV Trust Score: 43.20%
- Total #1 Ranked TV Keywords: 459
- Monthly TV Traffic: 39,400
- How they earn their money: Affiliate programs, User subscriptions, Investors, Advertisements, Sponsored posts
Testing Quality Analysis:
- Do they claim to test TVs?: Yes
- Do they have a TV Testing Methodology?: No
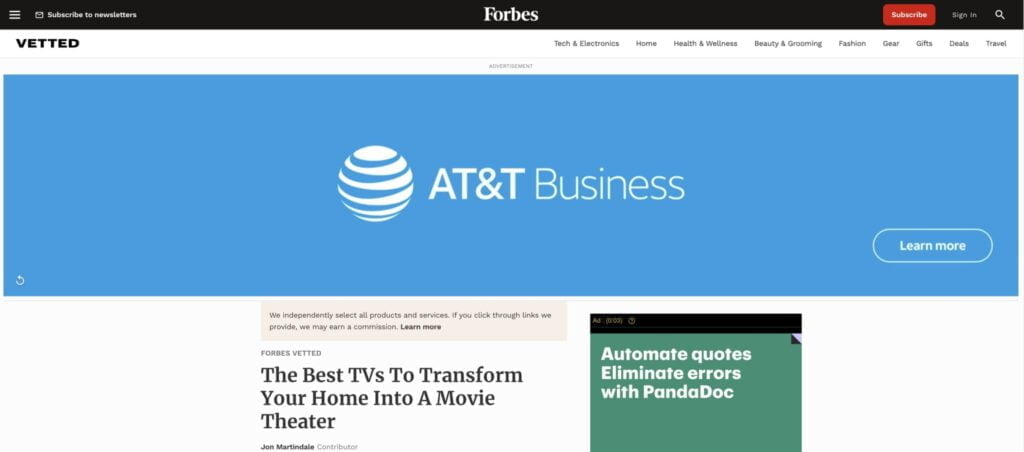
Forbes has run into issues with the consistency of their testing. Their failing score stems from the uneven way that TVs are tested across writers. Some claim to test, others don’t, some use concrete numbers, others don’t.
Even the presence of non-stock photos varies across reviews and it creates an environment where it is difficult to really understand how much testing is really being performed. Brightness is covered, but there’s no mention or proof of testing equipment, and the remaining custom questions we’ve laid out are fulfilled to different degrees by each review differently.
This uneven landscape raises serious questions about the validity of the numbers that Forbes does provide, as well as the truth behind their testing claims.
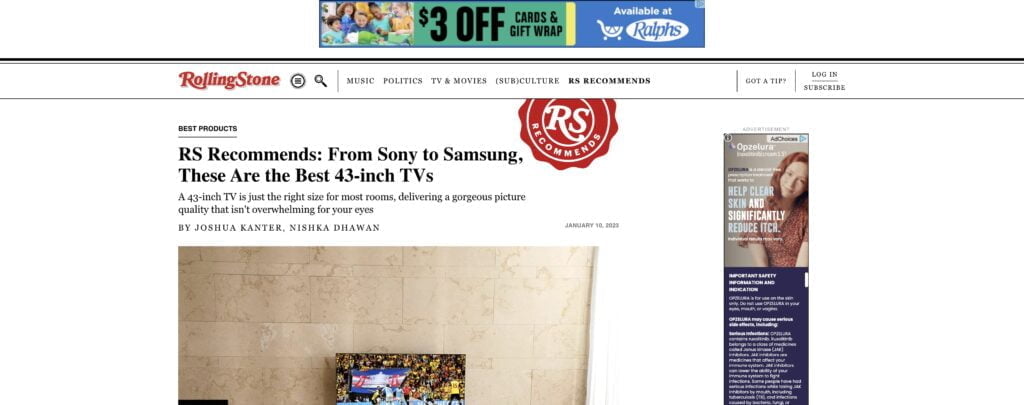
Publication #10: Rolling Stone
Profile Page | Buying Guide Example
- Parent Company: Penake Media Corporation
- Total #1 Ranked TV Keywords: 450
- Monthly TV Traffic: 89,700
- Type of Site: General News
- TV Trust Score: 11.20%
- How they earn their money: Affiliate programs, User subscriptions, Investors, Advertisements, Sponsored posts
Testing Quality Analysis:
- Do they claim to test TVs?: Yes
- Do they have a TV Testing Methodology?: No
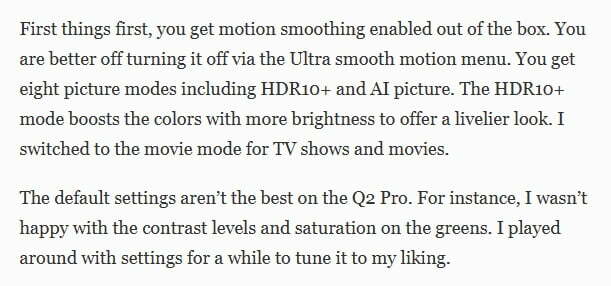
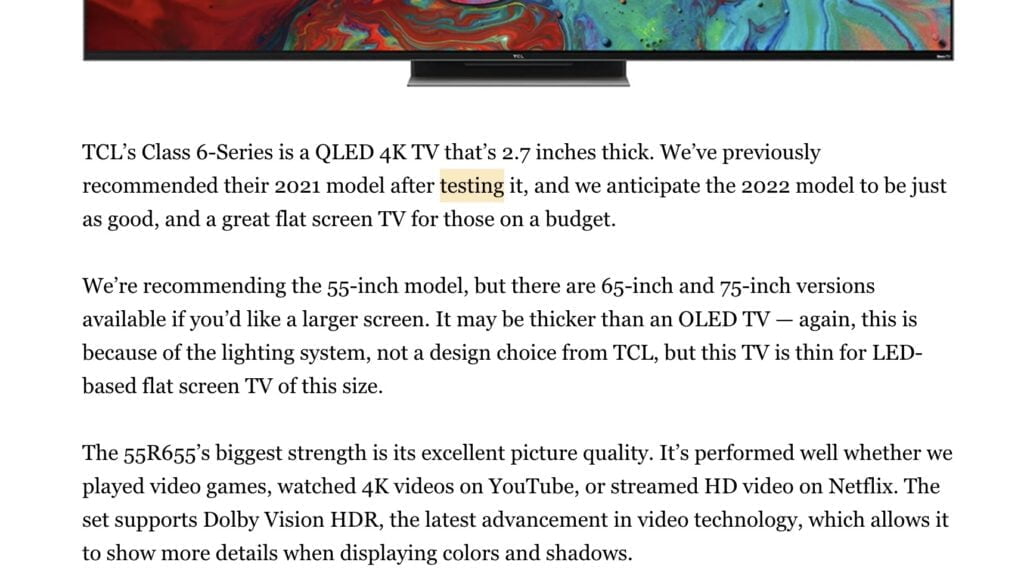
We could only find buying guides of TVs with their testing claims. It’s not believable that they actually tested the TVs due to the stock images and total lack of test results.
They state that a particular TCL TV model has excellent picture quality. That’s an entire category of performance, so the performance criteria color, contrast, and brightness must be all good too right? They also mention that they used the TV for video games, YouTube, and Netflix.
Where are the test results to prove all this? Not in this buying guide, that’s for sure.
Publication #11: Android Authority
- Parent Company: Authority Media
- Type of Site: Multiple Tech Review
- TV Trust Score: 45.60%
- Total #1 Ranked TV Keywords: 416
- Monthly TV Traffic: 73,900
- How they earn their money: Affiliate programs, Advertisements, Sponsored posts
Testing Quality Analysis:
- Do they claim to test TVs?: Yes
- Do they have a TV Testing Methodology?: No
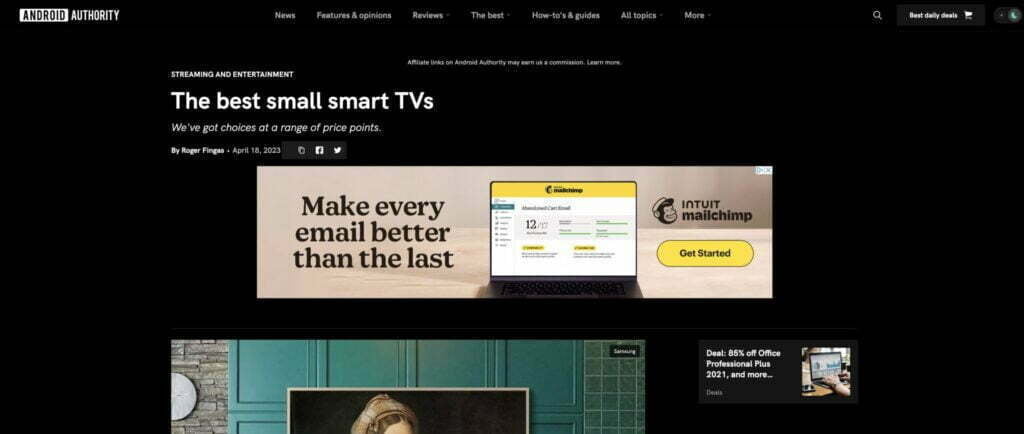
Android Authority runs into issues with testing claims. Though one of the reviews we sampled had no testing claims we could find, two of them did.
These reviews provided photos that weren’t stock, so the product was absolutely in the hands of the testers at some point, but the provided testing results don’t have the proof necessary to back them up.
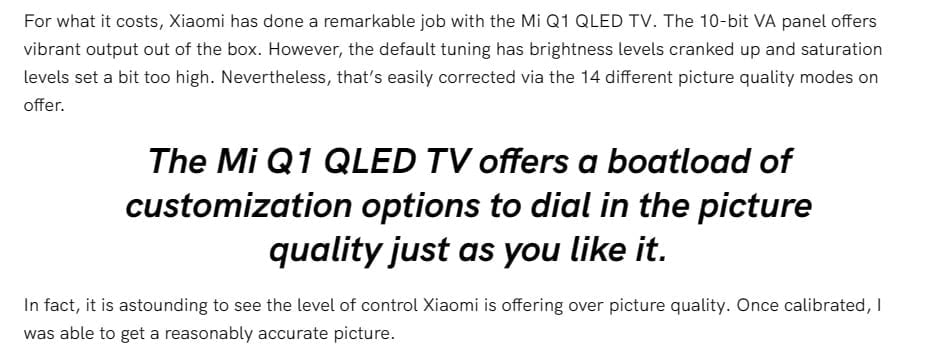
While including the brightness is good, the lack of any proof of brightness testing hurts them, as does the lack of any support for their claims about low input lag, good contrast, etc. One review even included NTSC and DCI-P3 coverage percentages but no mention of the equipment used to get these numbers of accompanying charts one would expect.
Publication #12: ZDNet

- Parent Company: Red Ventures
- Type of Site: Multiple Tech Review
- TV Trust Score: 38.20%
- Total #1 Ranked TV Keywords: 376
- Monthly TV Traffic: 108,900
- How they earn their money: Affiliate programs, Advertisements, Sponsored posts
Testing Quality Analysis:
- Do they claim to test TVs?: Yes
- Do they have a TV Testing Methodology?: No
ZDNet’s failure stems from the fact that, despite their claims of testing, very little of what is presented in their reviews supports any kind of proper testing beyond “using the TV.” A product test is more than just watching movies or playing games on a television.
There are plenty of photos to suggest that the testers at ZDNet did plenty of activities with their TVs, but there’s nothing that shows equipment being used to test brightness to get the reported nits measurements. Input lag and contrast are talked about in a qualitative sense with no hard numbers provided.
There’s plenty of proof they got the TVs and used them – but there’s not much proof they did anything beyond that.
Parent Company Trustworthiness Regarding TV Reviews_
We were seeing some parent companies frequently across the board while evaluating the search results. We wanted to find out the average Trust Scores that a parent company earned based on how their subsidiaries perform plus how much of the TV search results a parent company actually possesses.
RANK
PARENT COMPANY
SEARCH RESULTS COUNT
% OF SEARCH RESULTS POSSESSED
# OF PUBLICATIONS THEY OWN
AVERAGE TRUST SCORE
1
Future PLC
433
26.84%
11
37.50%
2
Red Ventures
152
9.42%
2
63.60%
3
Ziff Davis
97
6.01%
3
56.67%
4
Gannett Co., Inc.
70
4.34%
1
74.20%
5
New York Times
54
3.35%
1
75.00%
6
Designtechnica Corporation
50
3.10%
1
70.00%
7
Trusted Reviews Limited
26
1.61%
1
80.40%
8
Alphabet Inc.
25
1.55%
1
33.8%
9
Condé Nast
16
0.99%
1
26.80%
10
Dotdash Meredith
12
0.74%
2
31.00%
11
Vox Media
12
0.74%
1
34.40%
12
Integrated Whale Media Investments
10
0.62%
1
43.20%
13
IDG Inc.
10
0.62%
2
41.00%
14
Hearst Digital Media
8
0.50%
3
17.07%
15
AV Tech Media Americas Inc.
1
0.06%
1
85.20%
As you can see, Future PLC holds the largest portion of the search results out of any other parent company (over a quarter of the 1,613 search results!).
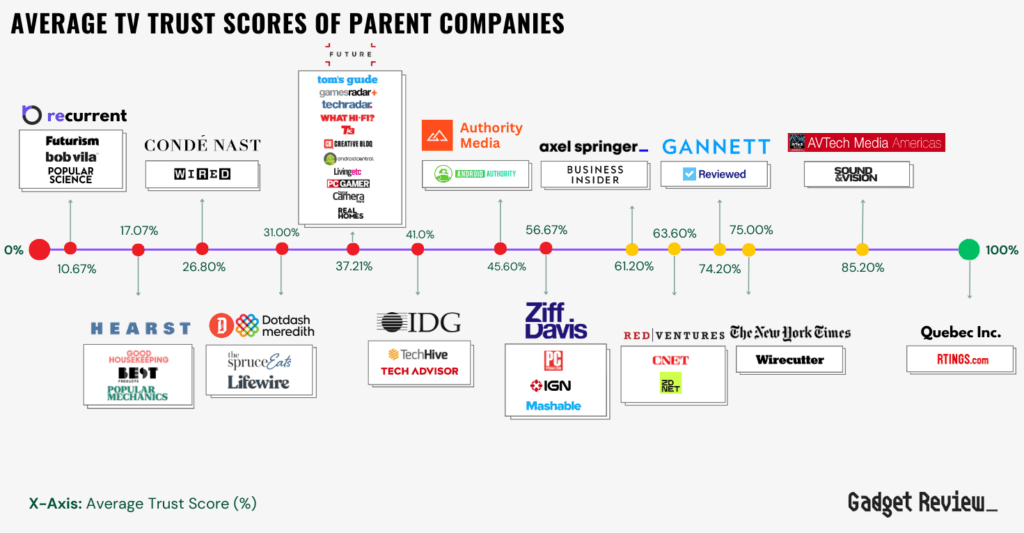
However, other parent companies like Quebec Inc. and AV Tech Media Americas Inc. outshine them when it comes to average Trust Scores. Quebec Inc. possesses only 10.42% of the search results and AV Tech Media Americas Inc. only gets a tragic 0.06% of the whole pie despite their impressive 83.58% average Trust Score.
Here’s a graphic of the above average Trust Scores laid out of a spectrum:
The presence that a site or parent company possesses within the TV keyword SERPs is important to note because this can translate to the profit these parent companies are raking in. To be frank, the market potential of TV affiliate keywords is enormous–meaning there are millions of dollars at stake here.
Total Addressable Market (TAM) for Affiliate TV Keywords_
The global television industry itself is already a $259.16 billion USD industry as of 2021 and has been consistently growing. Being an extremely profitable industry, it attracts many publications to pursue writing expert TV reviews.
To give some perspective as to how substantial the market potential is for the TV category for expert reviews alone, here are some statistics below, and the actual math behind these numbers is in this spreadsheet.
TERM
VALUE
DEFINITION OF TERM
Total US TV Review Keyword Market Share
Number of “best/review/how-to/what-is/etc.” transactional, review-related TV keywords that are applicable to affiliate publications.
Total TV Monthly Searches
6,100,000
How many times users search for the keywords in the Total TV Keyword Market Share.
Potential Monthly Affiliate Traffic
4,880,000
80% of the Total TV Monthly Searches. This is an estimation of the traffic that actually goes to affiliate publications aside from e-commerce sites.
Retailer Traffic
2,366,800
This is 48.5% of the Potential Monthly Affiliate Traffic above. We send on average 48.5% of our TV-related traffic to retailers.*
Monthly Sales
236,680
This is 10% of the Retailer Traffic. 10% of that monthly traffic converts into actual sales.*
Monthly E-Commerce Sales via Affiliates
$104,139,200
Multiply the Monthly Sales by the Average TV Order Value to get this total sale amount that E-Commerce retailers earn.
Average Commission Rate
1.17%
Review Site Monthly Revenue
$1,218,429
Multiply the Monthly E-Commerce Sales by the Avg. Commission Rate to get the potential monthly revenue that publications earn.
Review Site Annual Revenue
$14,621,144
Multiply the Monthly Revenue by 12 to get the final annual revenue that goes to publications.
Gross Profit Margin
The difference between earned revenue and operating expenses for publishers in this case. This percentage varies across industries.
Monthly Gross Profit
$567,179
Multiply the Monthly Revenue by the Margin.
Annual Gross Profit
$6,806,142
Multiply the Annual Revenue by the Margin.
*Based on our own traffic data in Google Search Console. Gadget Review receives over 100,000 visitors in regards to our TV content every month.
“Best 85 inch TV” SERP_
Let’s take a look at some TV-related Search Engine Results Pages (SERPs) now that we know how much money is at stake here. The query “best 85 inch TV” earns 6,600 searches every month, which is a pretty competitive keyword.
For more context regarding how much a site can earn if it’s in a SERP’s #1 spot, Gadget Review was #1 in the “best TVs for bedroom” SERP for the entire month of January 2023. That query earns 1,000 searches a month, and our buying guide earned $231.54 that month.
On this “best 85 inch TV” SERP screenshot below, we’ve highlighted in red the publications that earned failing Trust Scores under 60% and those that passed in green.
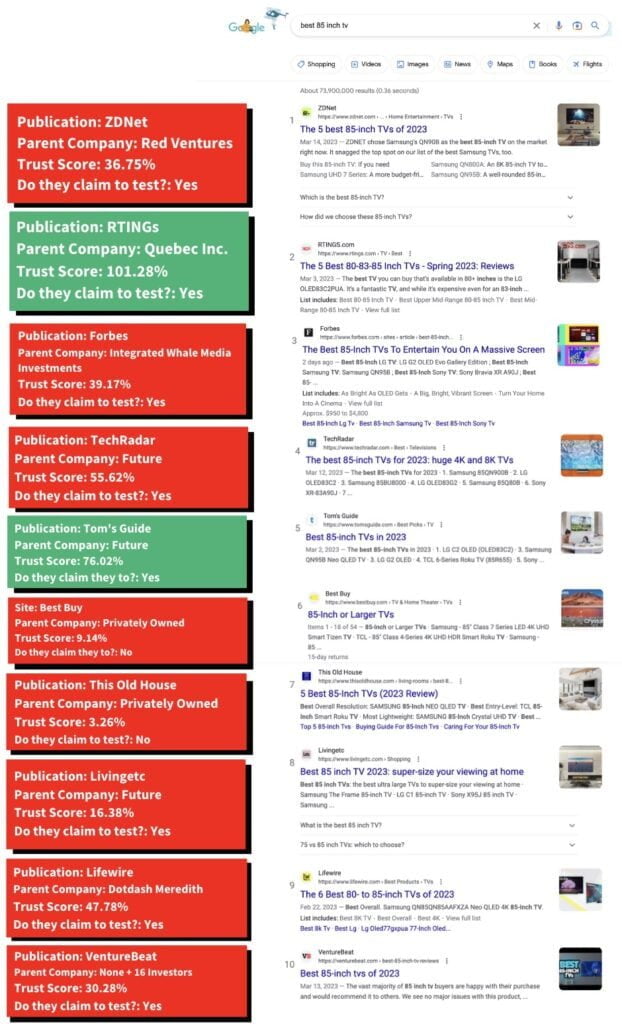
It’s alarming that two of the top three publications received failing Trust Scores. Positions 1 to 3 earn the most clicks out of the entire top 10 results, so it’s unfortunate that most of the traffic is going to publications that have unhelpful, surface-level content
“Best TV” SERP_
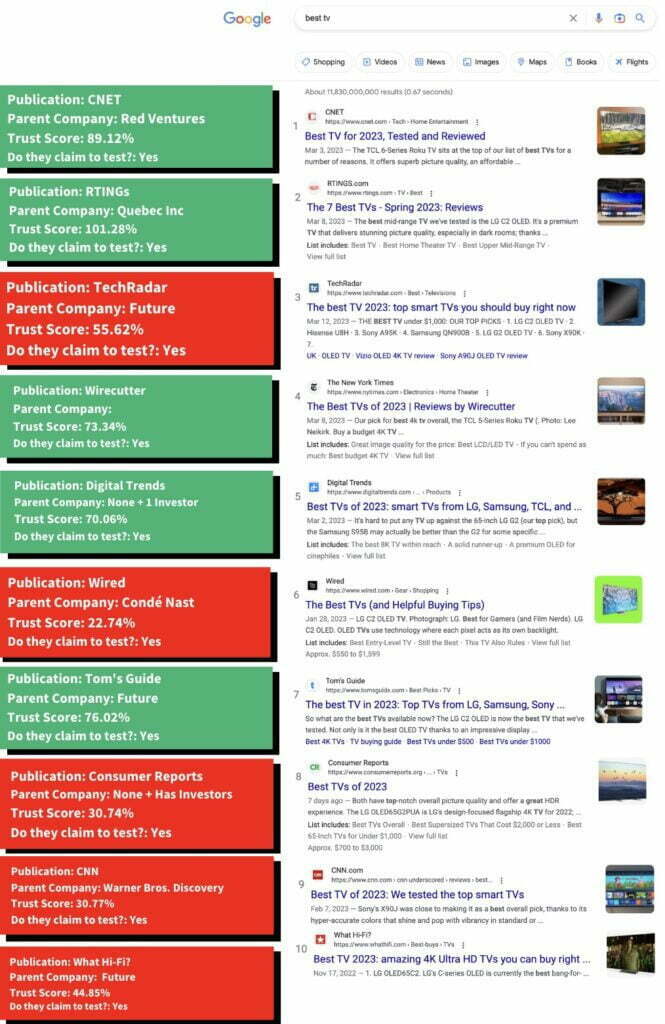
What about broader search term SERPs with very high search volume? “Best TV” is a very competitive query that earns over 33,000 searches a month. This SERP is fairly healthy but has room to improve.
Looking at the SERP below, the third seat is taken by a publication that failed our Trust Score criteria. However, the top two positions usually earn more clicks than the third, so at least the bulk of the traffic is going to expert testers with passing Trust Scores. Referring back to our “best tvs for bedroom” example, the top seated results on this SERP are probably raking in thousands of dollars.
Top 10 Publications By Google’s TV Keyword Market Share_
The following table is sorted from highest to lowest according to how many keywords a site has in the #1 position in a SERP. We’ve excluded general e-commerce sites from this list along with sites that don’t claim to test TVs.
| # | PUBLICATION | PARENT COMPANY | TOTAL RANKING TV KEYWORDS | TOTAL RANKING TV KEYWORDS IN TOP 3 | TOTAL #1 RANKING TV KEYWORDS (SORTED) | MONTHLY TV TRAFFIC | TRUST SCORE |
|---|---|---|---|---|---|---|---|
| 1 |  | Quebec Inc. | 62,382 | 6,770 | 4,189 | 555,400 | 101.40% |
| 2 |  |  | 183,458 | 5,218 | 2,039 | 399,600 | 89.00% |
| 3 |  |  | 160,587 | 4,754 | 1,587 | 377,500 | 77.80% |
| 4 |  |  | 109,368 | 3,590 | 1,405 | 142,900 | 48.40% |
| 5 |  |  | 156,526 | 2,623 | 1,342 | 144,400 | 75.00% |
| 6 |  | – No parent company found – No Crunchbase profile to find any investors | 41,716 | 2,076 | 1,192 | 58,400 | 26.00% |
| 7 |  |  | 69,764 | 2,078 | 1,112 | 95,100 | 20.60% |
| 8 |  |  | 85,007 | 2,269 | 900 | 106,800 | 29.80% |
| 9 |  |  | 43,908 | 1,460 | 781 | 56,200 | 74.20% |
| 10 |  | – No parent company found – Non-Profit but supported by investors and grants | 81,748 | 1,744 | 761 | 102,600 | 35.40% |
The Top TVs & Awards_
The following are some of our top TV models which we determined by our True Score system. In this TV Trust List, we’ve elaborated on expert Trust Scores that feed into the True Score calculation, and we highly recommend you learn how we gather our data to fulfill the other elements that calculate the True Scores.
| NAME OF PRODUCT | TRUE SCORE | AWARD | PLACE TO BUY |
|---|---|---|---|
| Samsung Q80/Q80T QLED TV | 91 | Best TV for Bright Room | Amazon |
| Sony A80J OLED | 91 | Best Sony TV Best TV for Apple TV | Amazon |
| LG C1 OLED Series TV | 90 | Best LG TV Best TV for Apple TV | Amazon |
To be transparent, the Amazon links are affiliate so we earn a small commission with each purchase. Here is how we earn money at this current time. However, Gadget Review is on a path to move away from relying only on affiliate commissions and bring our readers these Trust Lists and True Scores, which you can learn more about in our financials transparency blog.
The Next Evolution Of This Trust List_
This concludes our Trust List that analyzed the best and worst TV testers and the current climate of the TV review industry.
Our goal was to help you discover a way to spot that fake review, and to follow our lead on the most trusted sites out there when it comes to purchasing your latest television.
And we’re not finished yet! This Trust List has room to grow, so make sure to check back soon! In the next version, we want to incorporate more actionable opportunities that you, the consumer, can check out. Here’s what’s coming next:
- TV Buying Guides based on the True Scores
- Long-term authentic customer reviews
????Assets To Our TV Review Investigation
- TV Trust Scores Airtable View
- Trust Score Criteria Breakdown
- TV Publications That Say “Tested” or “Tried” Airtable View
- Parent Company Average TV Trust Scores Airtable View
- Trust Score Classifications
- Type of Site Average TV Trust Scores Airtable View
- TV Keyword Market Share Airtable View
- TV Keywords Search Results Breakdown & Analysis
Make sure you invite a friend or family member to join our mailing list!


![Best Drones Under the Cost of Ferrari in [year] 86 Best Drones Under the Cost of Ferrari in 2026](https://www.gadgetreview.dev/wp-content/uploads/image-test-3.jpg)
![Best 27 Inch Computer Monitor in [year] 87 Best 27 Inch Computer Monitor in 2026](https://www.gadgetreview.dev/wp-content/uploads/how-to-buy-the-best-computer-monitor.jpg)
![Best Powered Speakers in [year] 88 Best Powered Speakers in 2026](https://www.gadgetreview.dev/wp-content/uploads/best-powered-speakers-image.jpg)
![Best Stereo Speakers in [year] 89 Best Stereo Speakers in 2026](https://www.gadgetreview.dev/wp-content/uploads/best-stereo-speakers-image.jpg)


